Dashboard Preferences, which is accessible under your username (Configure button), allows you to customize the portlets that you see on your Dashboard along with changing your Landing Page:


After clicking on Configure button, the following screen will appear:

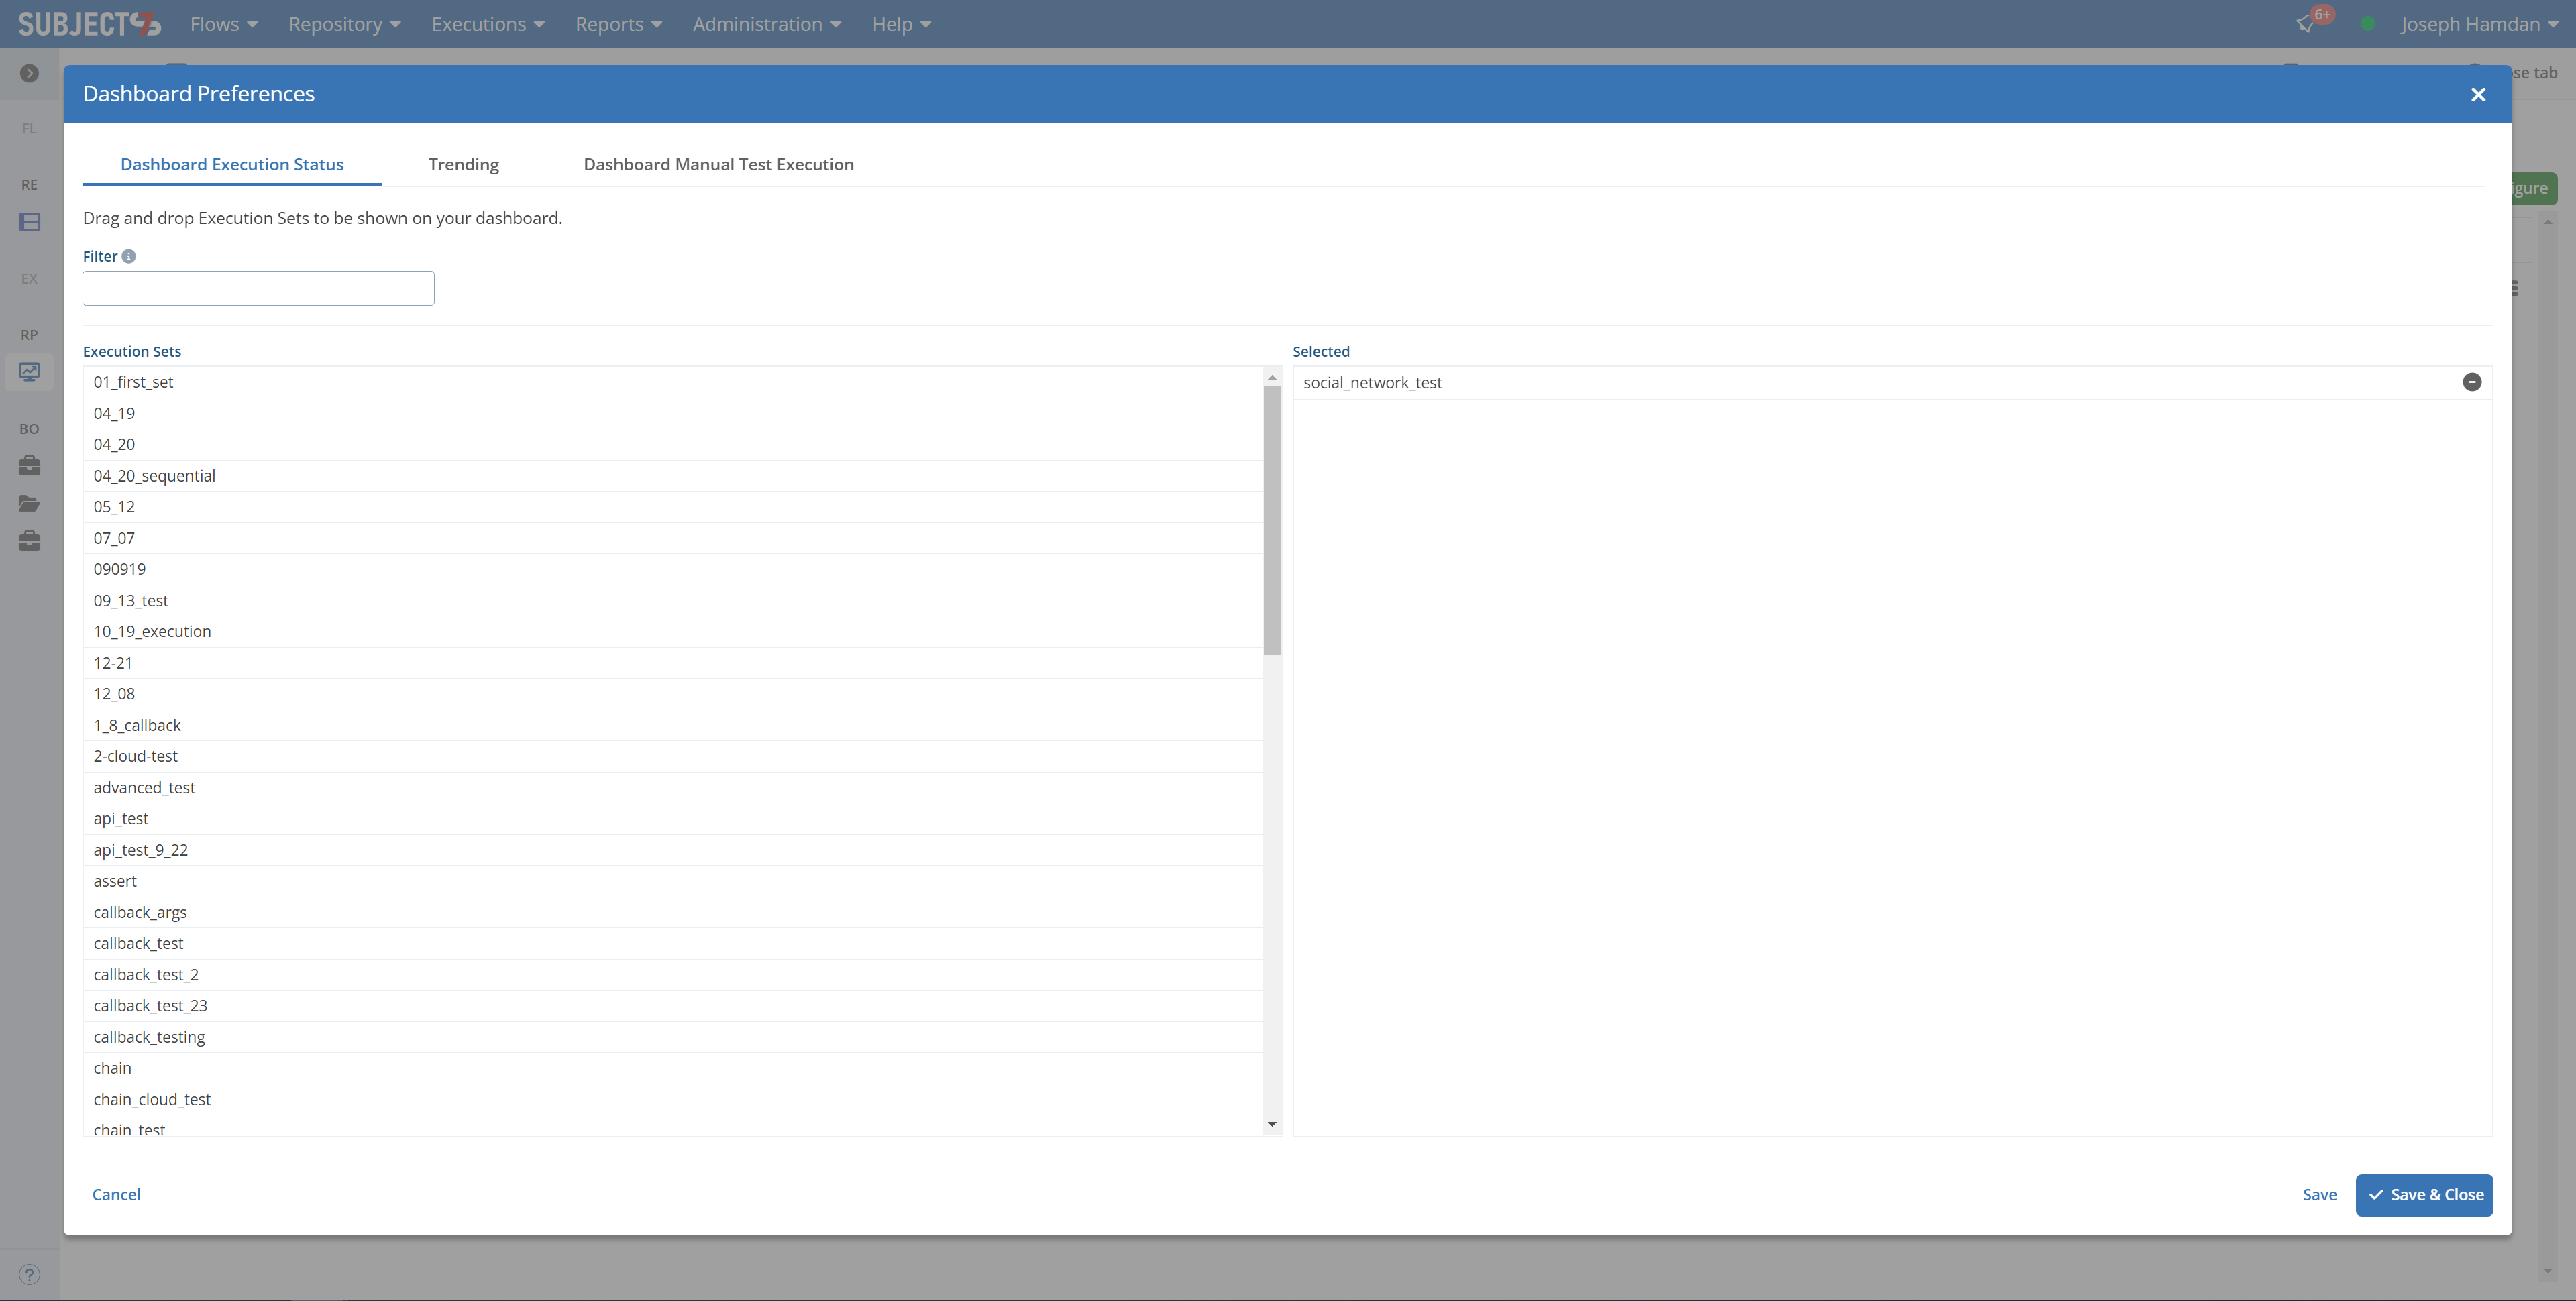
Executions Tabs
...
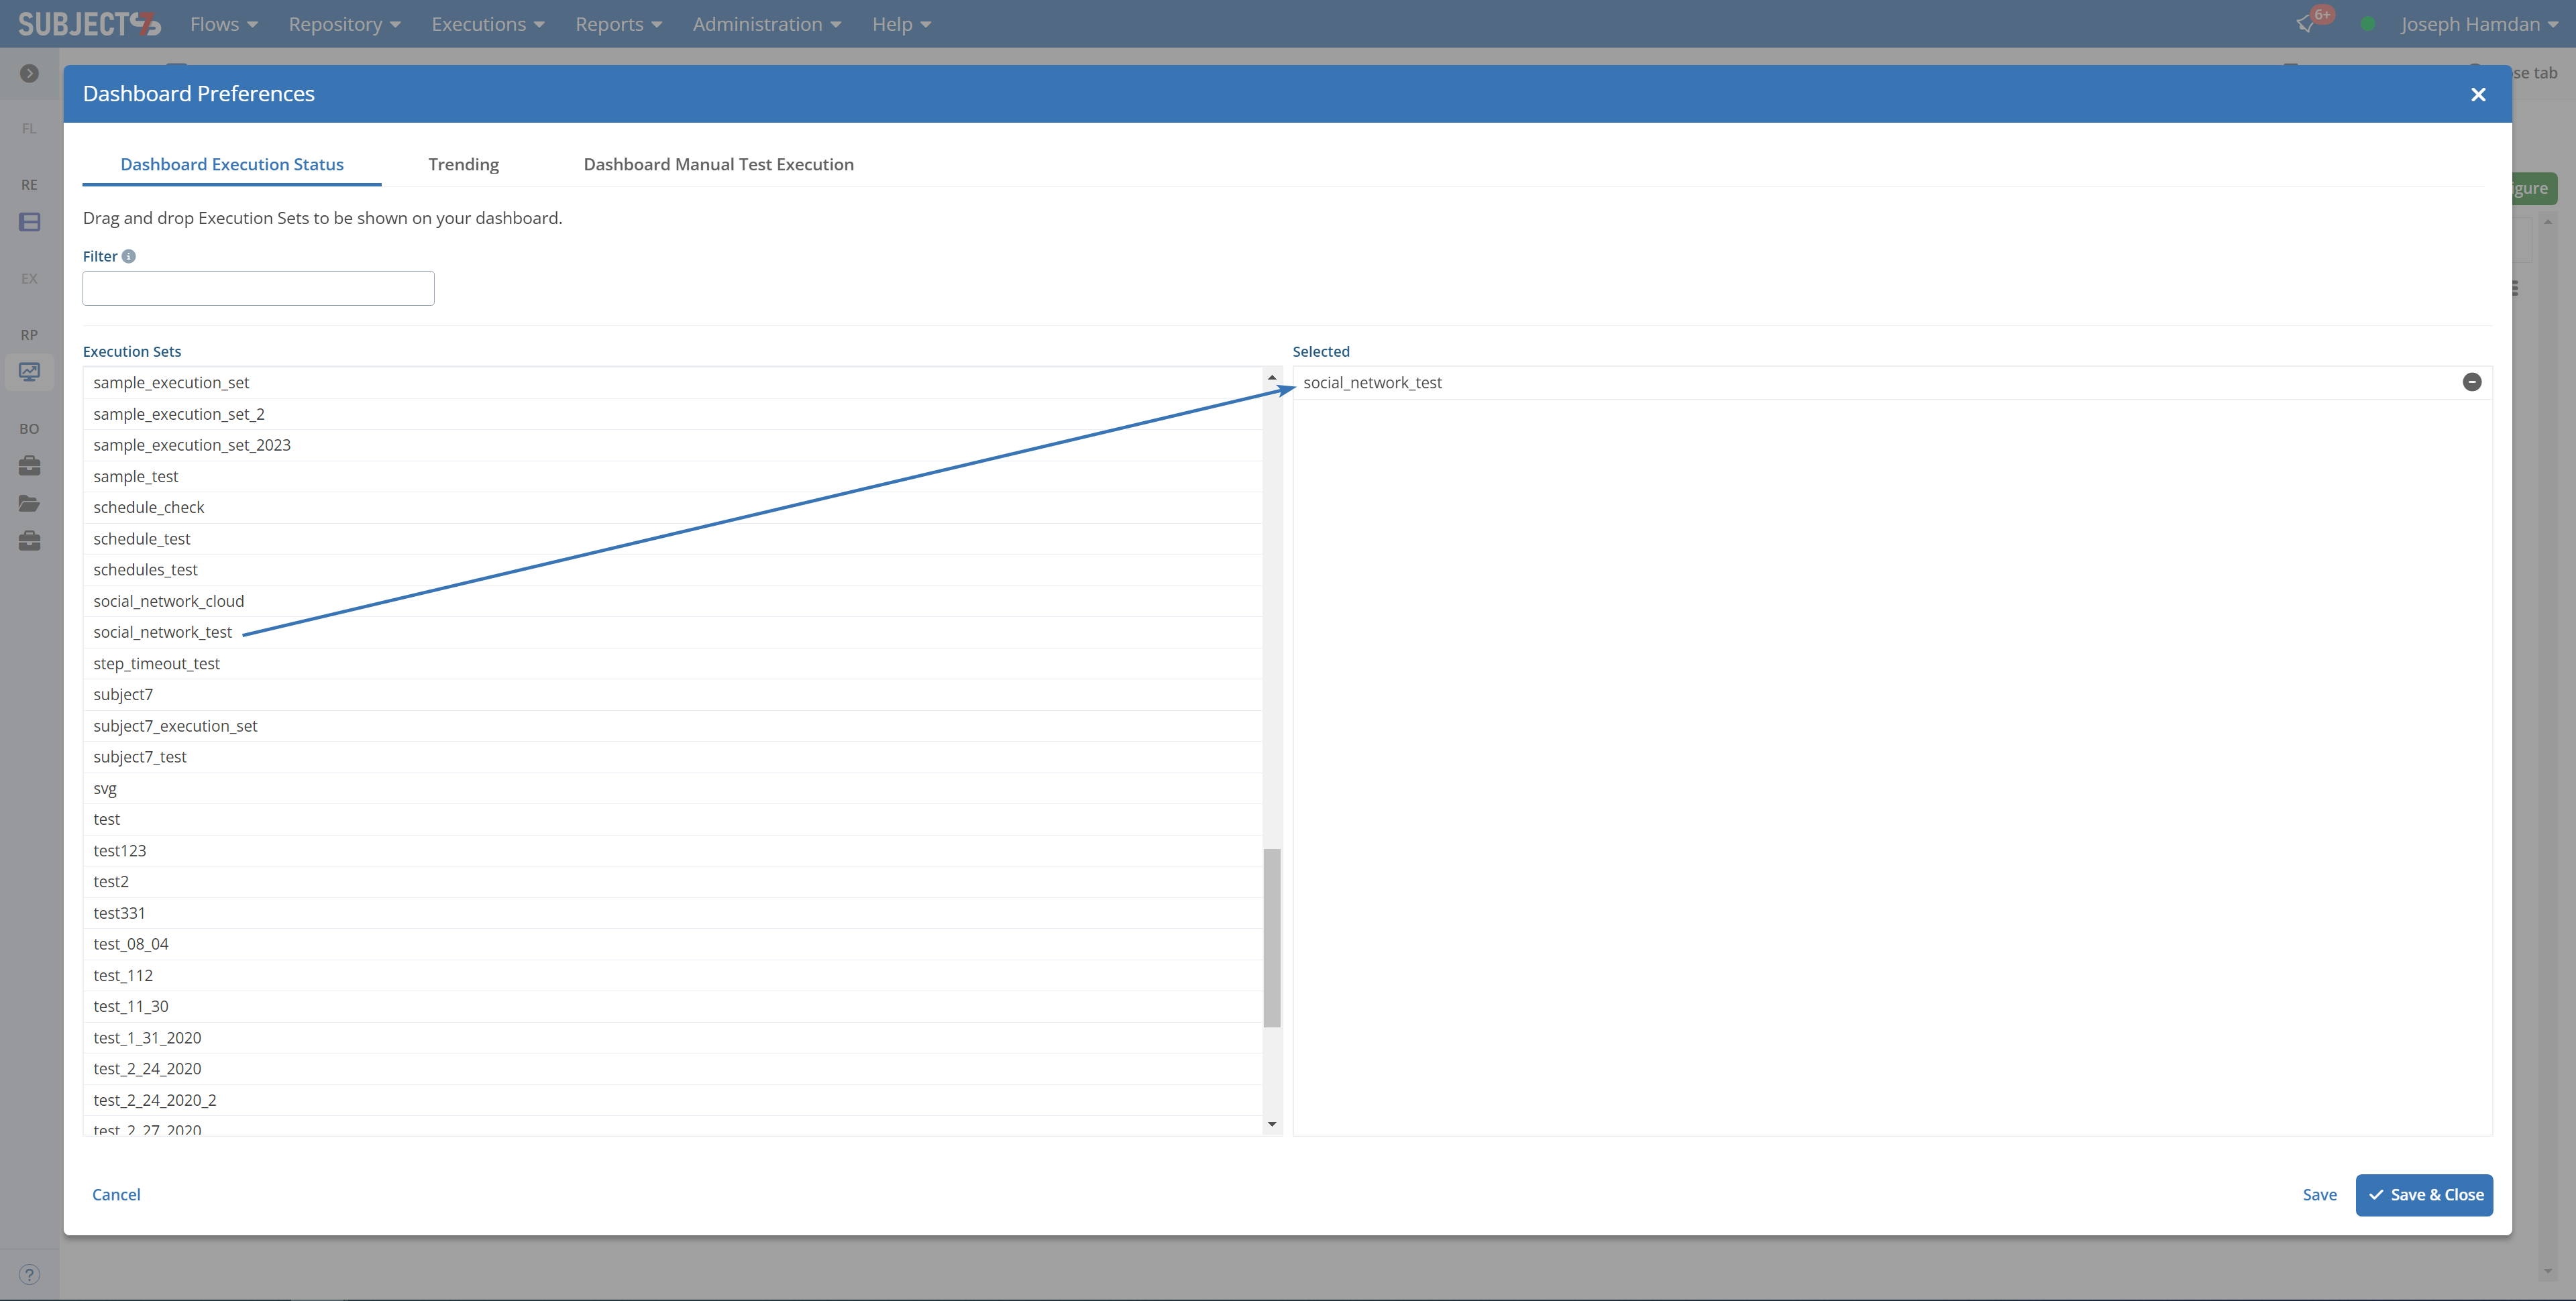
1. To select the Execution Sets of interest, drag and drop Execution Sets as shown on the left-hand side to the Selected execution sets on the right-hand side and click Save.

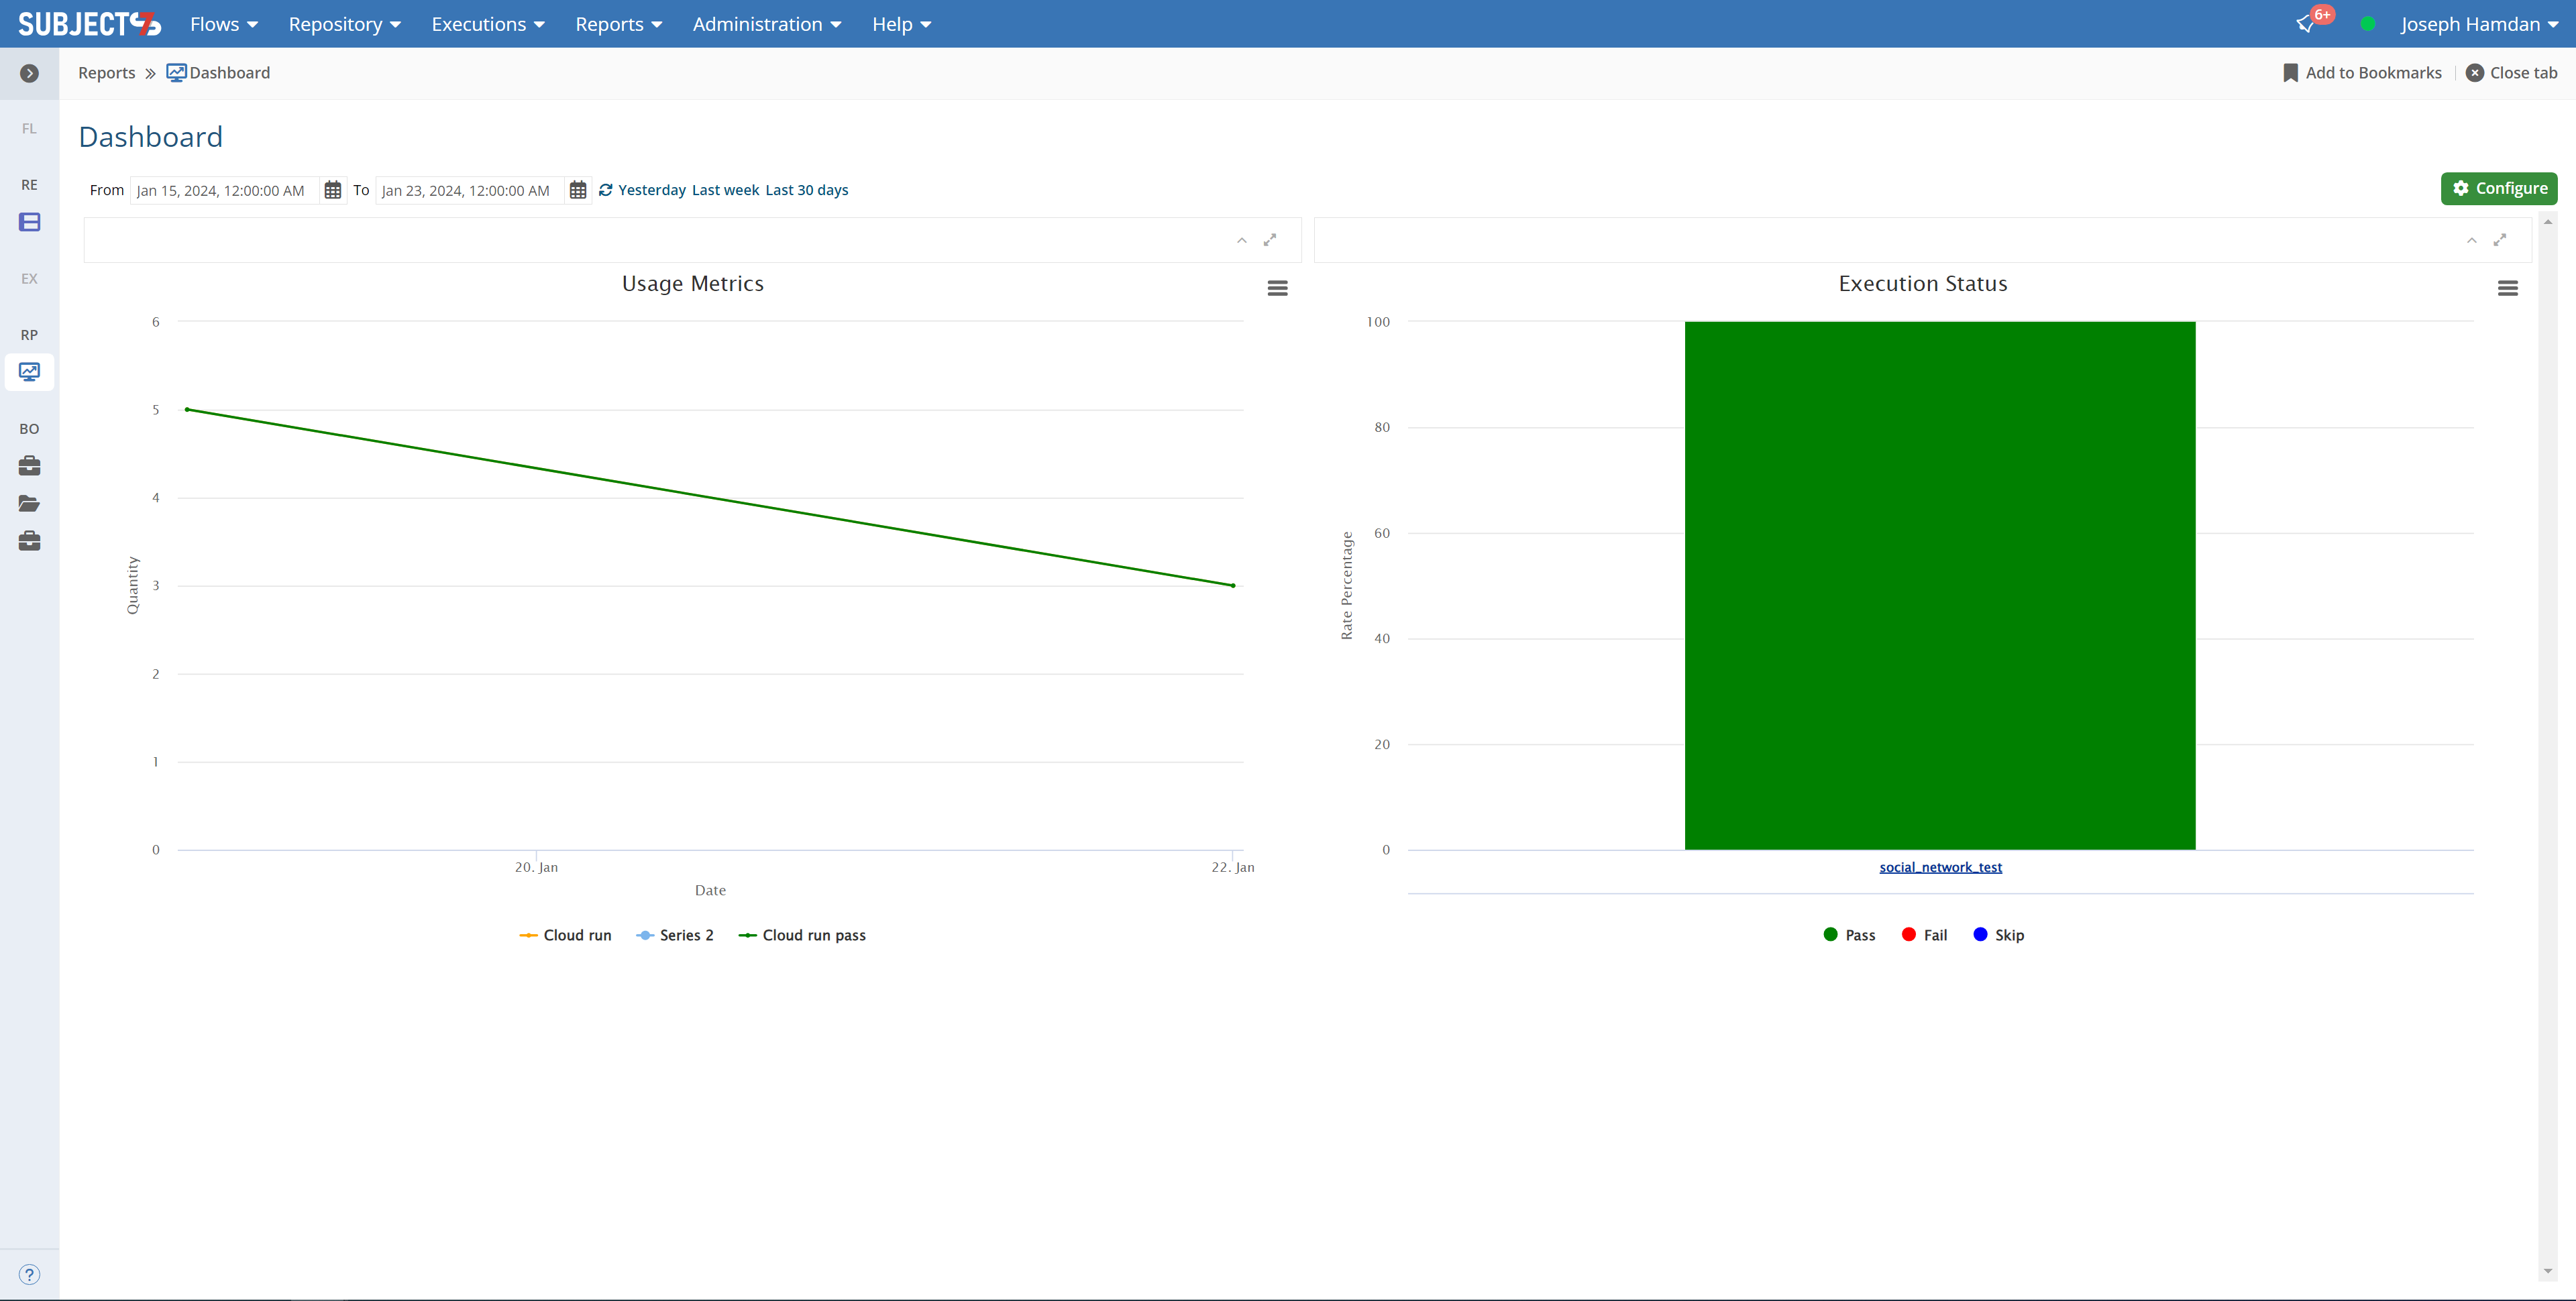
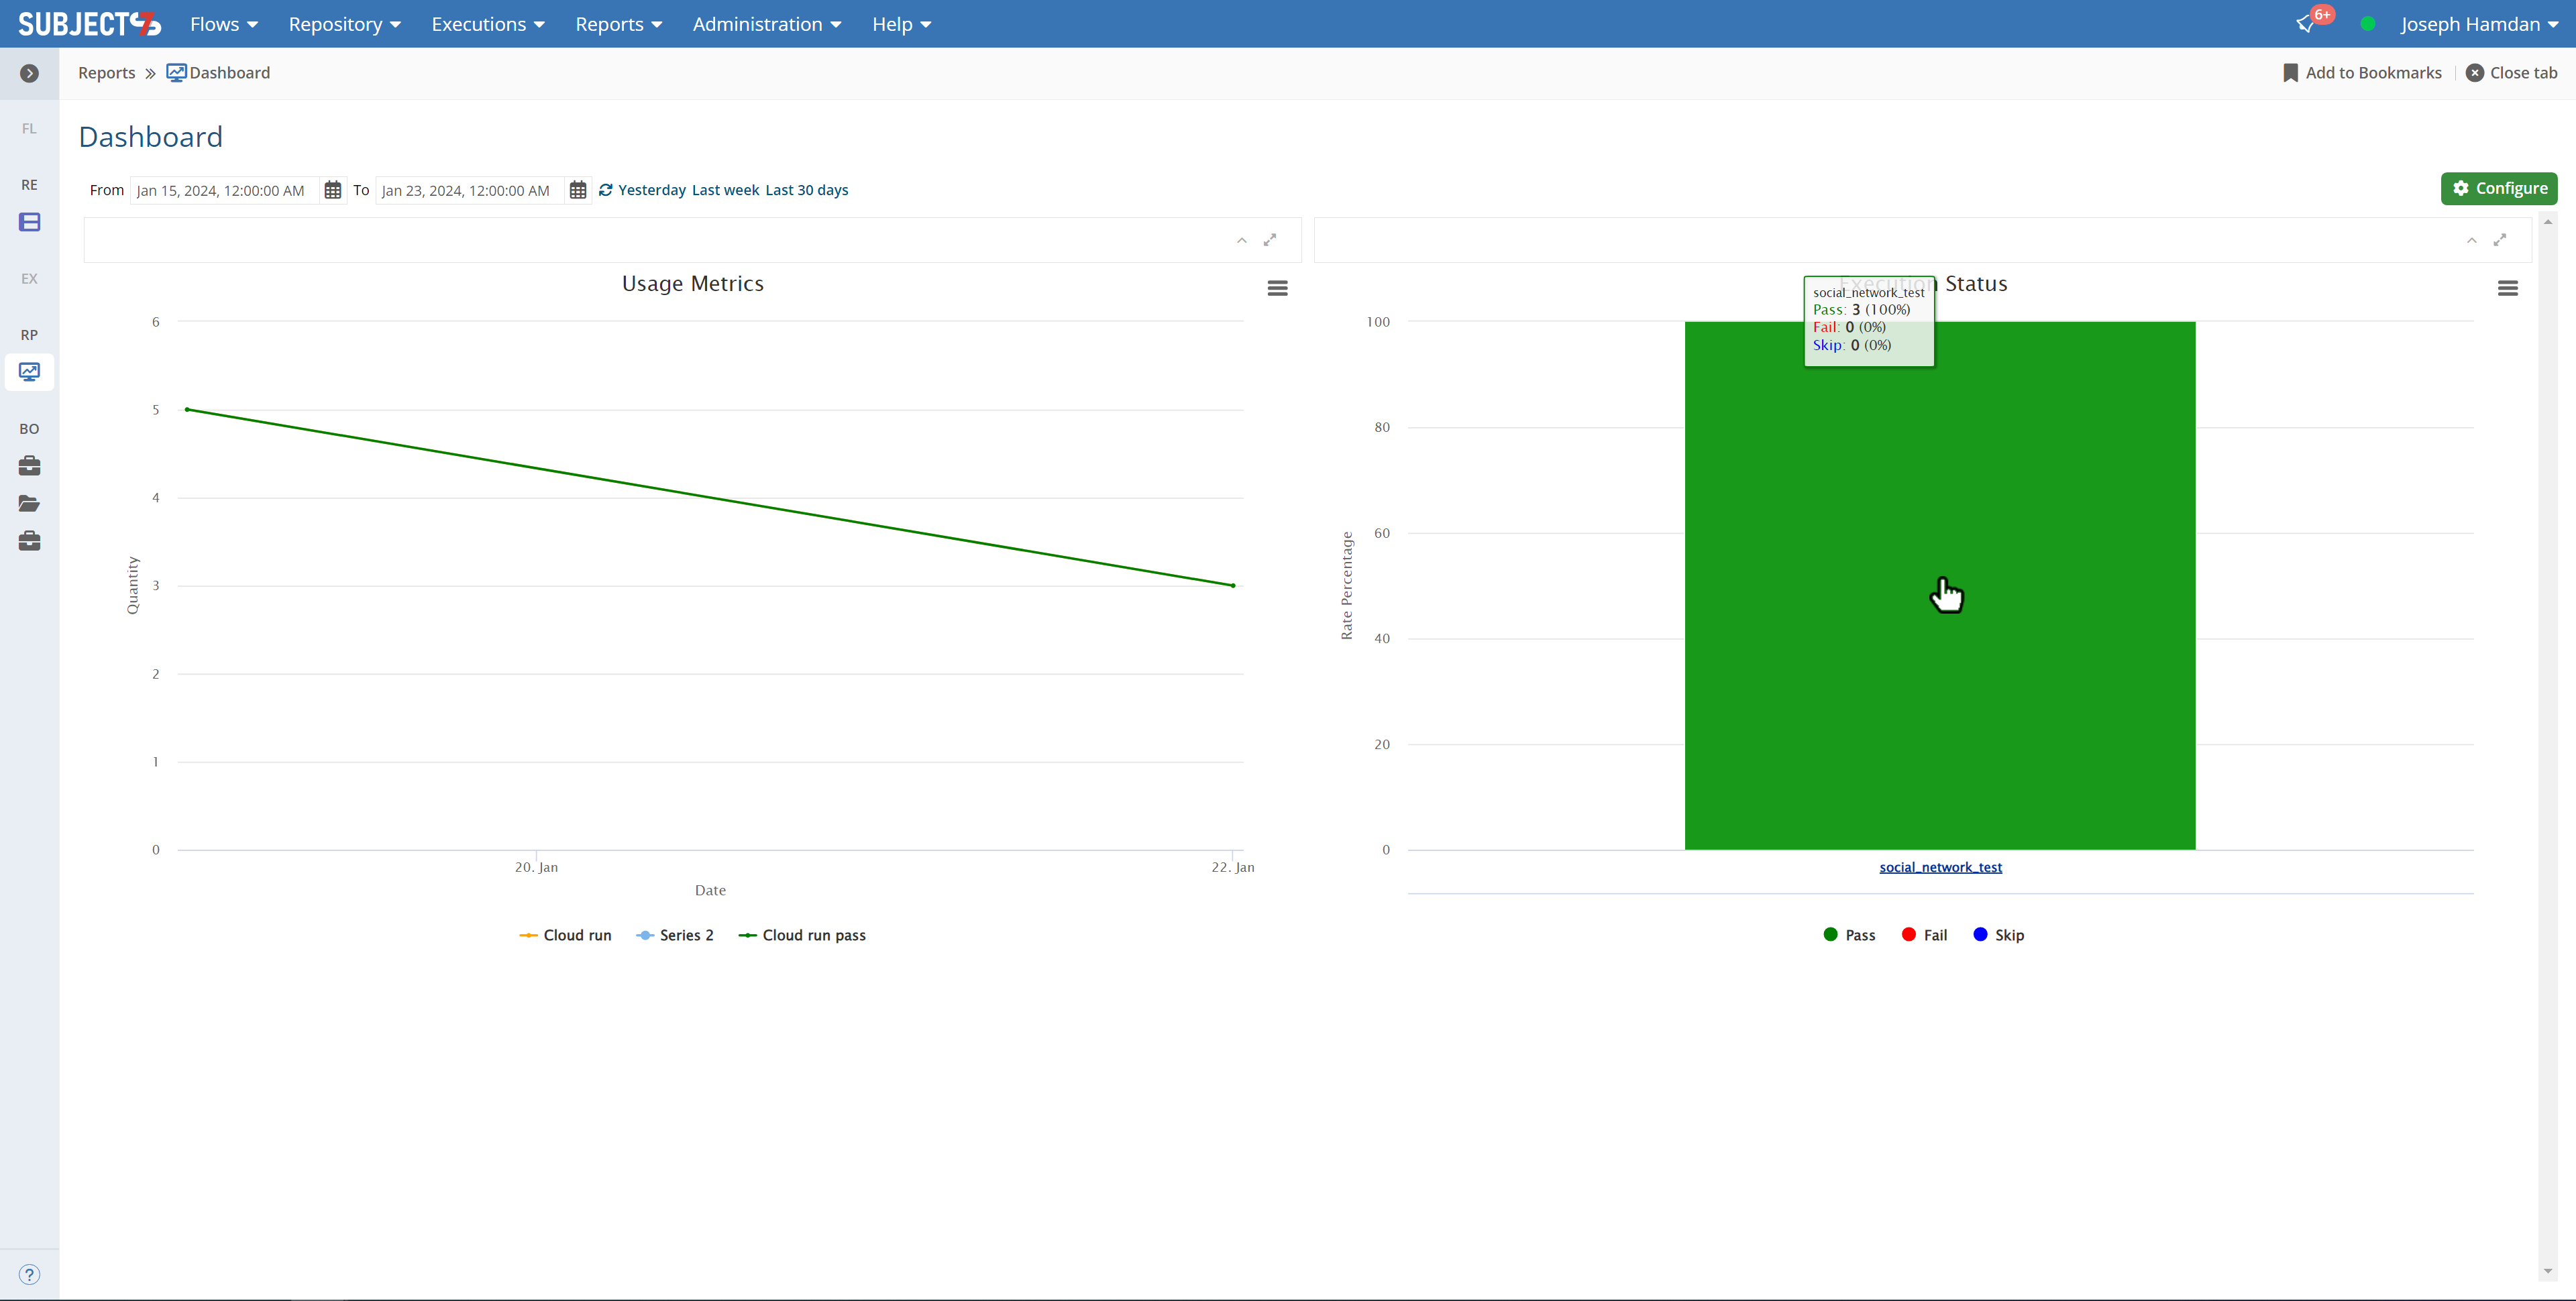
 2. Close Preferences to return to the Dashboard and notice the changes made to Execution Status as below.

| Info | ||
|---|---|---|
| ||
The number of times a local run is executed is counted on the dashboard graph, but this does not count the number of times where a test case was stopped and resumed from specific steps. |
3. You can click on the graph which will direct you to the executions screen.

4. To add trending test cases to view on your dashboard and monitor , click on Trending and drag and drop items from the Test Library on the left to the Selected section on the right. When finished, click Save.

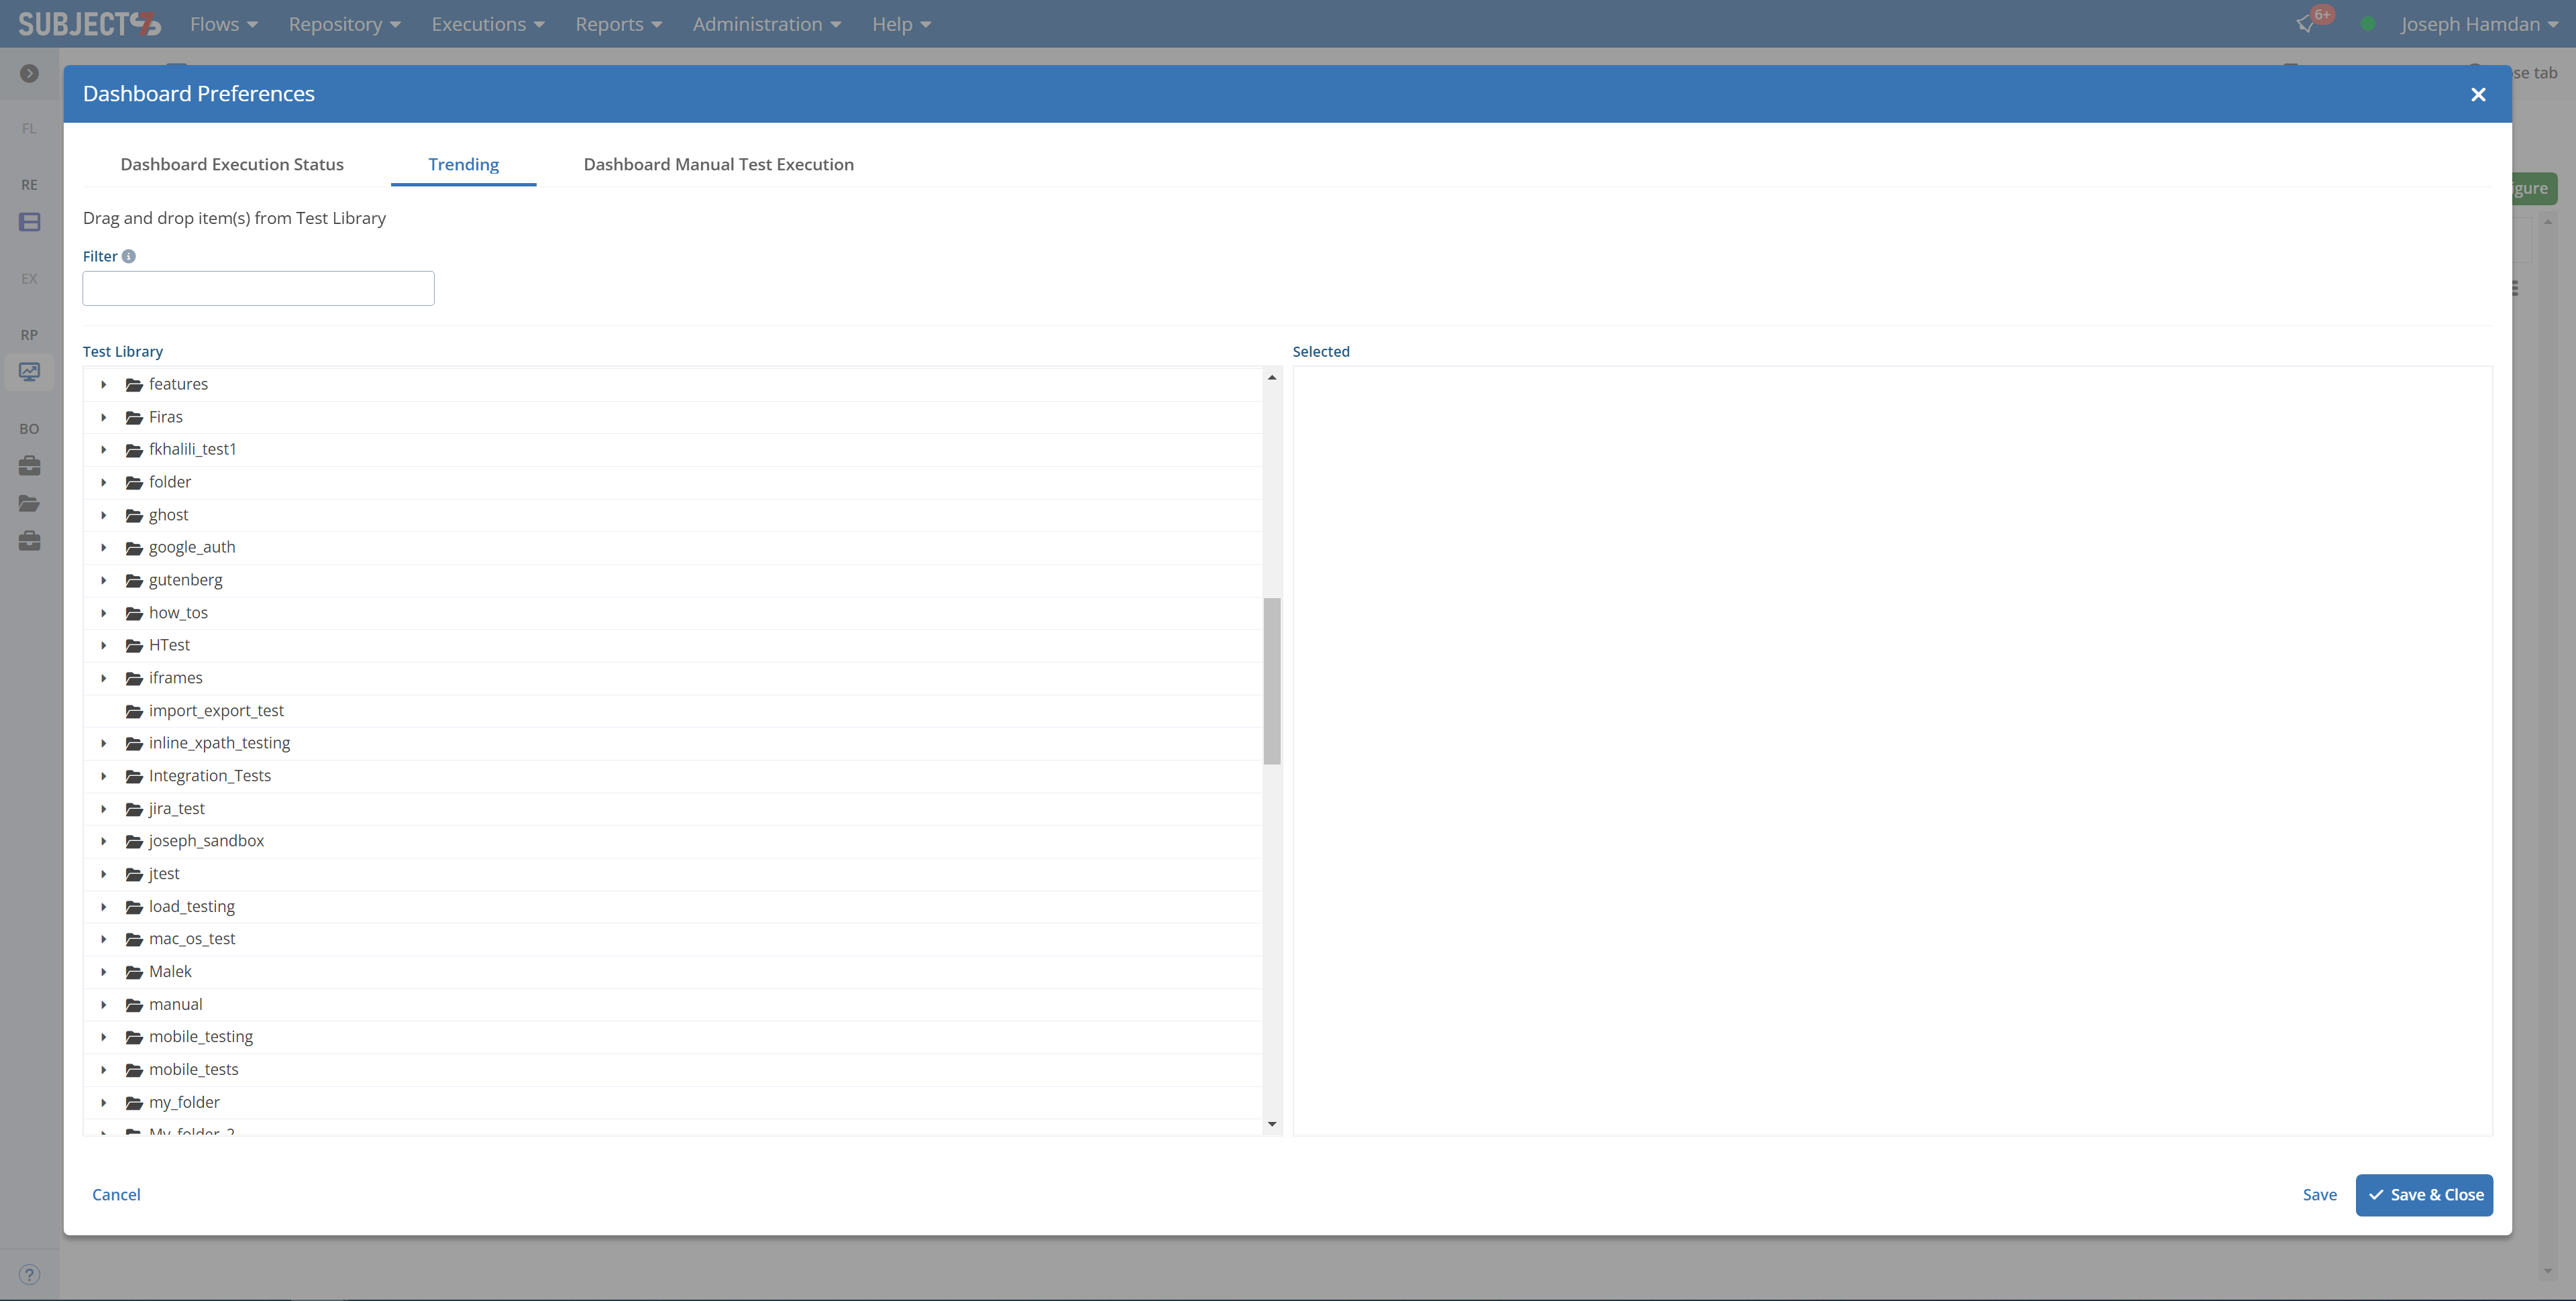
The video below shows how you can filter through the cloud run pass by date range:
...
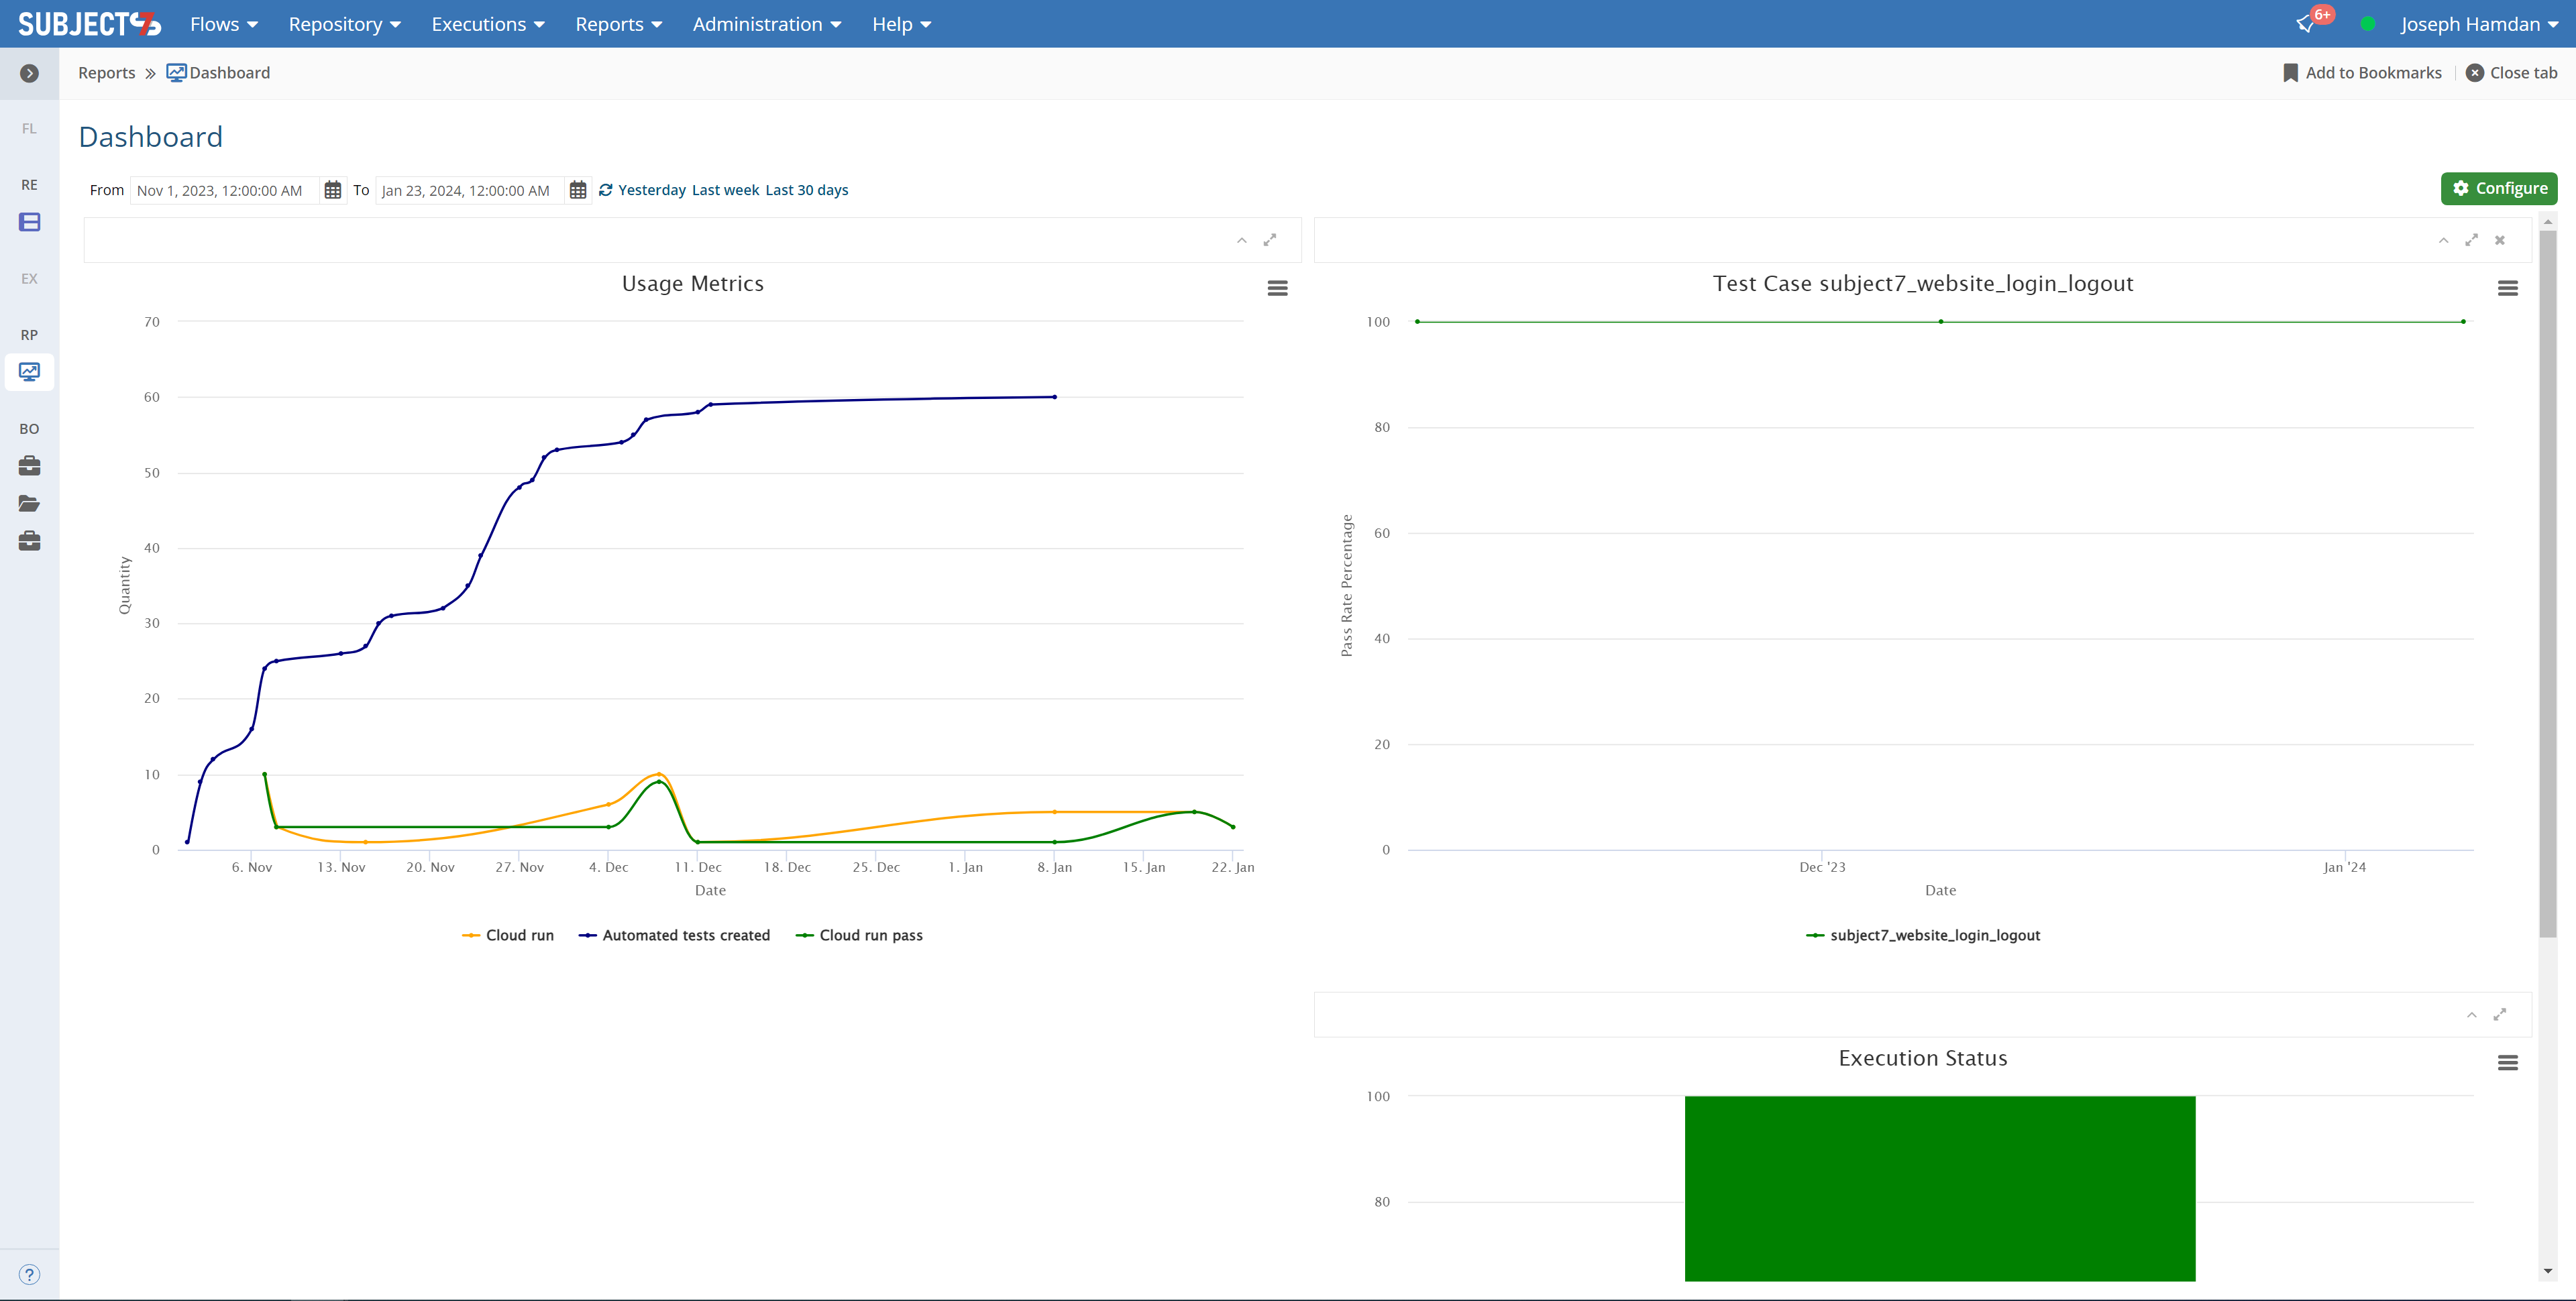
5. Close Preferences to return to the Dashboard and notice the new Trending widget that shows the test case you selected.

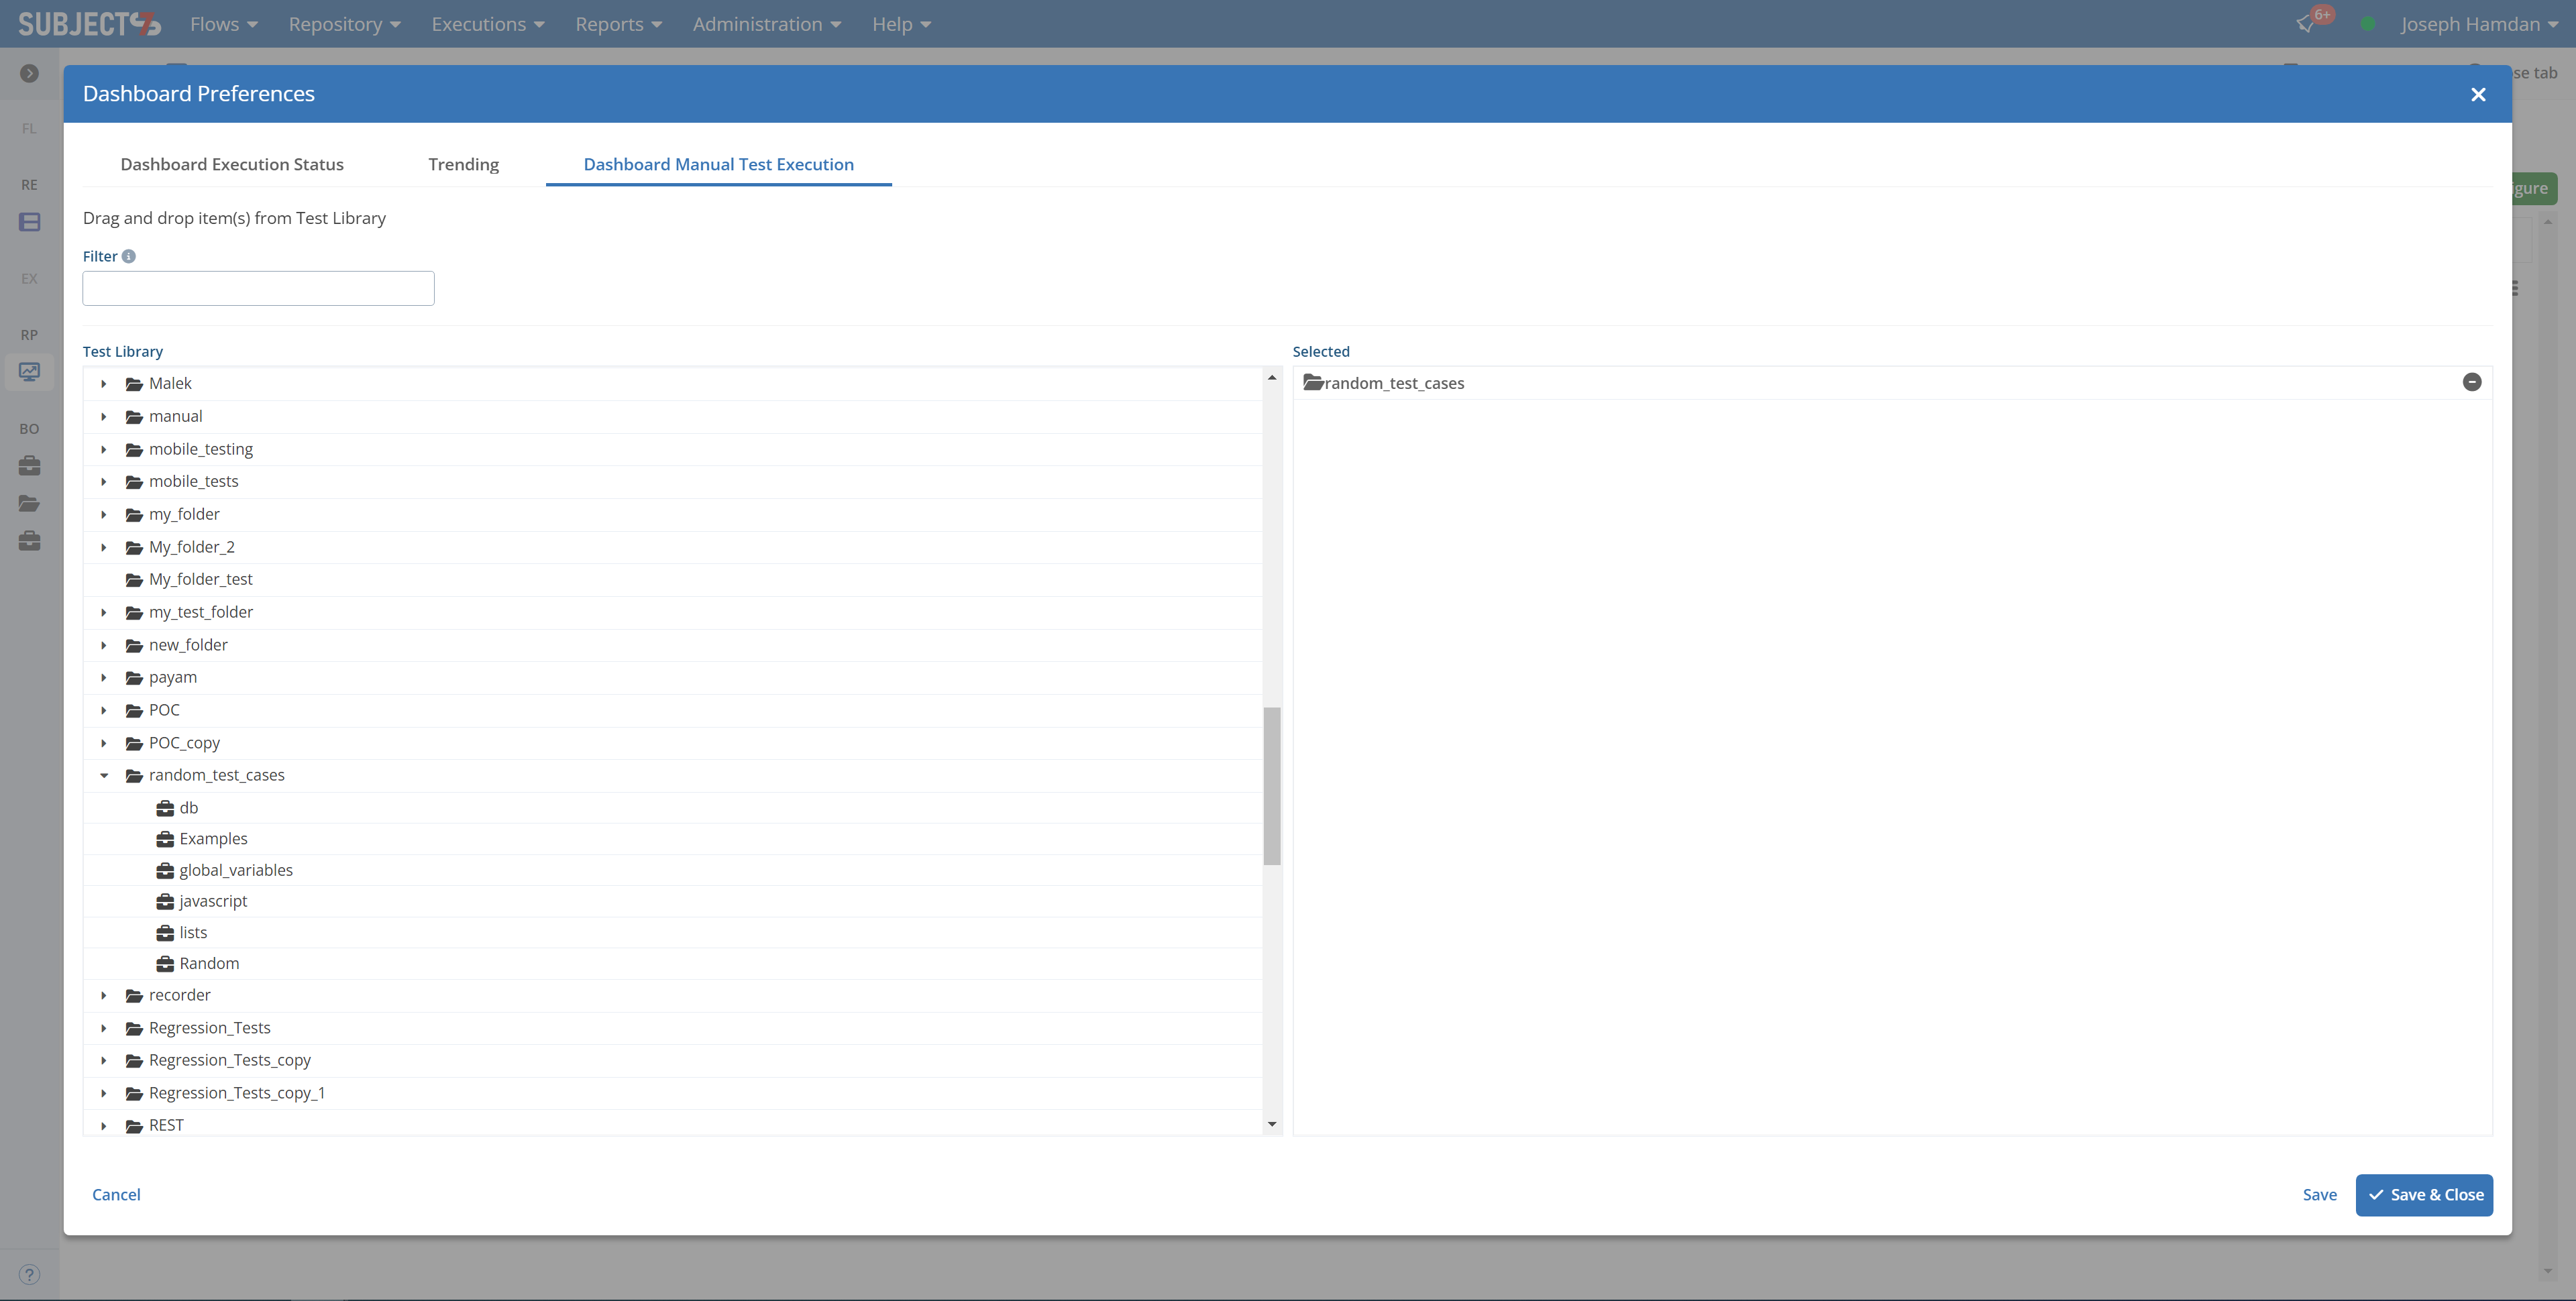
 6. To select the Dashboard Manual Test Execution of interest, drag and drop the test(s) shown on the left-hand side to the Selected sets on the right-hand side and click Save.

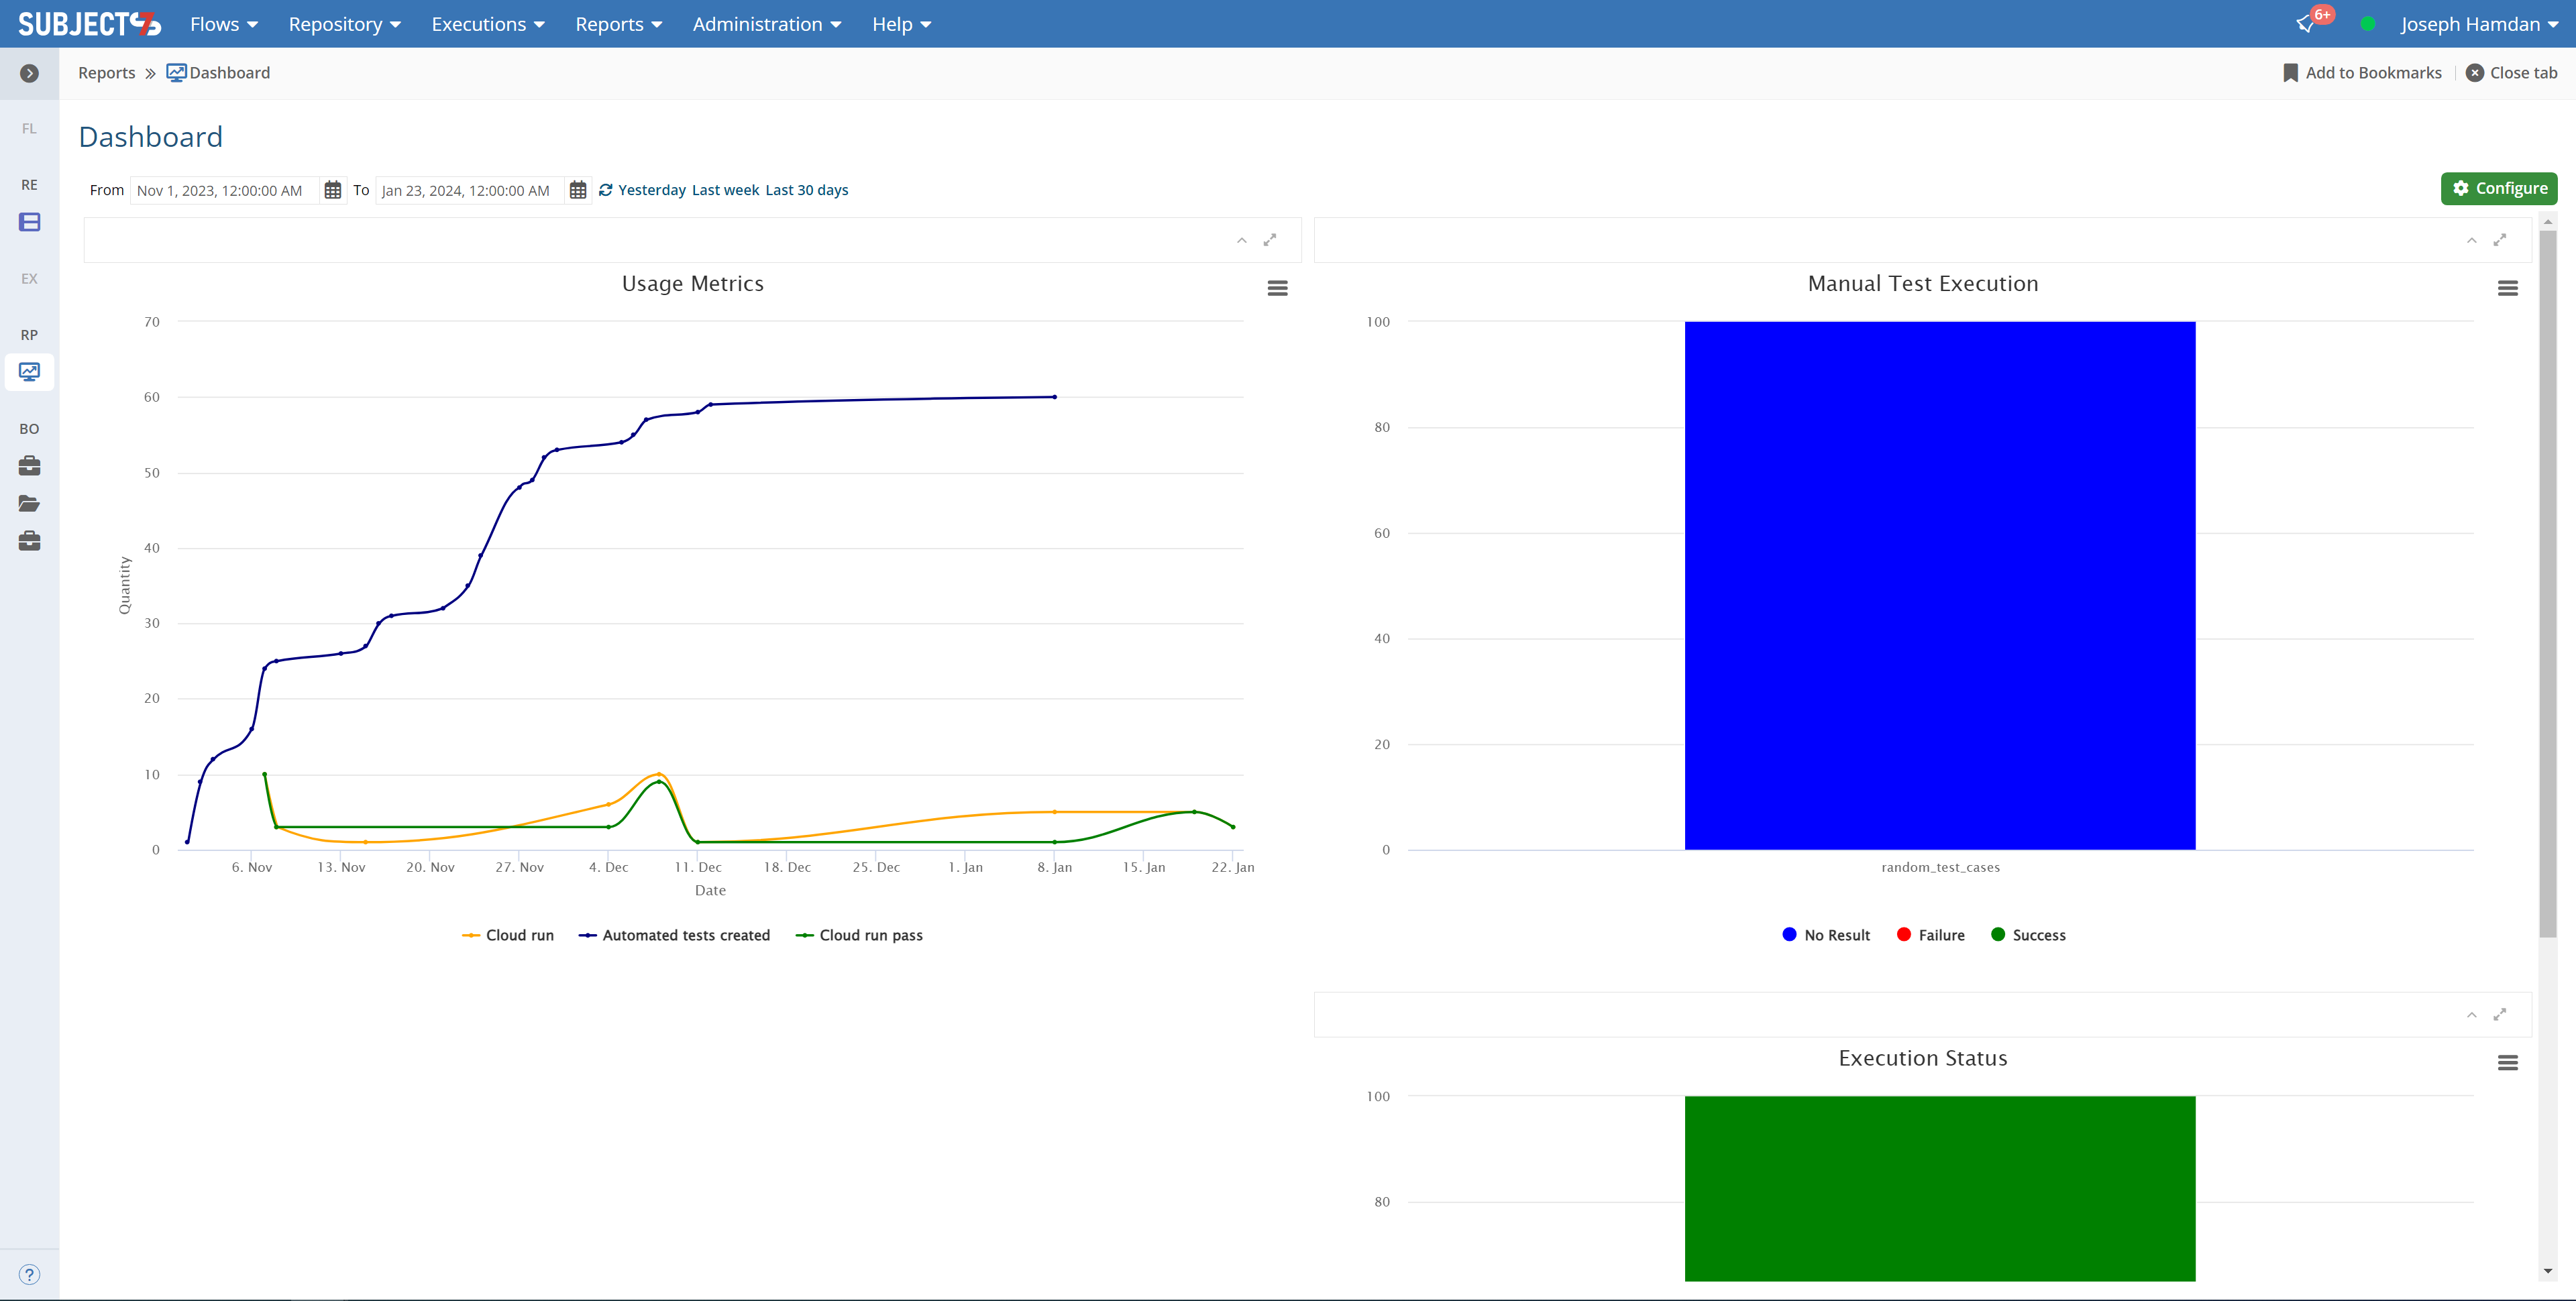
7- Close Preferences to return to the Dashboard and notice the new Manual Test Execution widget.

Filtering Bar Charts
...
This graph shows all test cases created, all the cloud runs made and all the cloud run passes obtained over a period of time determined on the main page. You can turn off any of these graphs on or off by clicking on the legends of the graphs highlighted below:

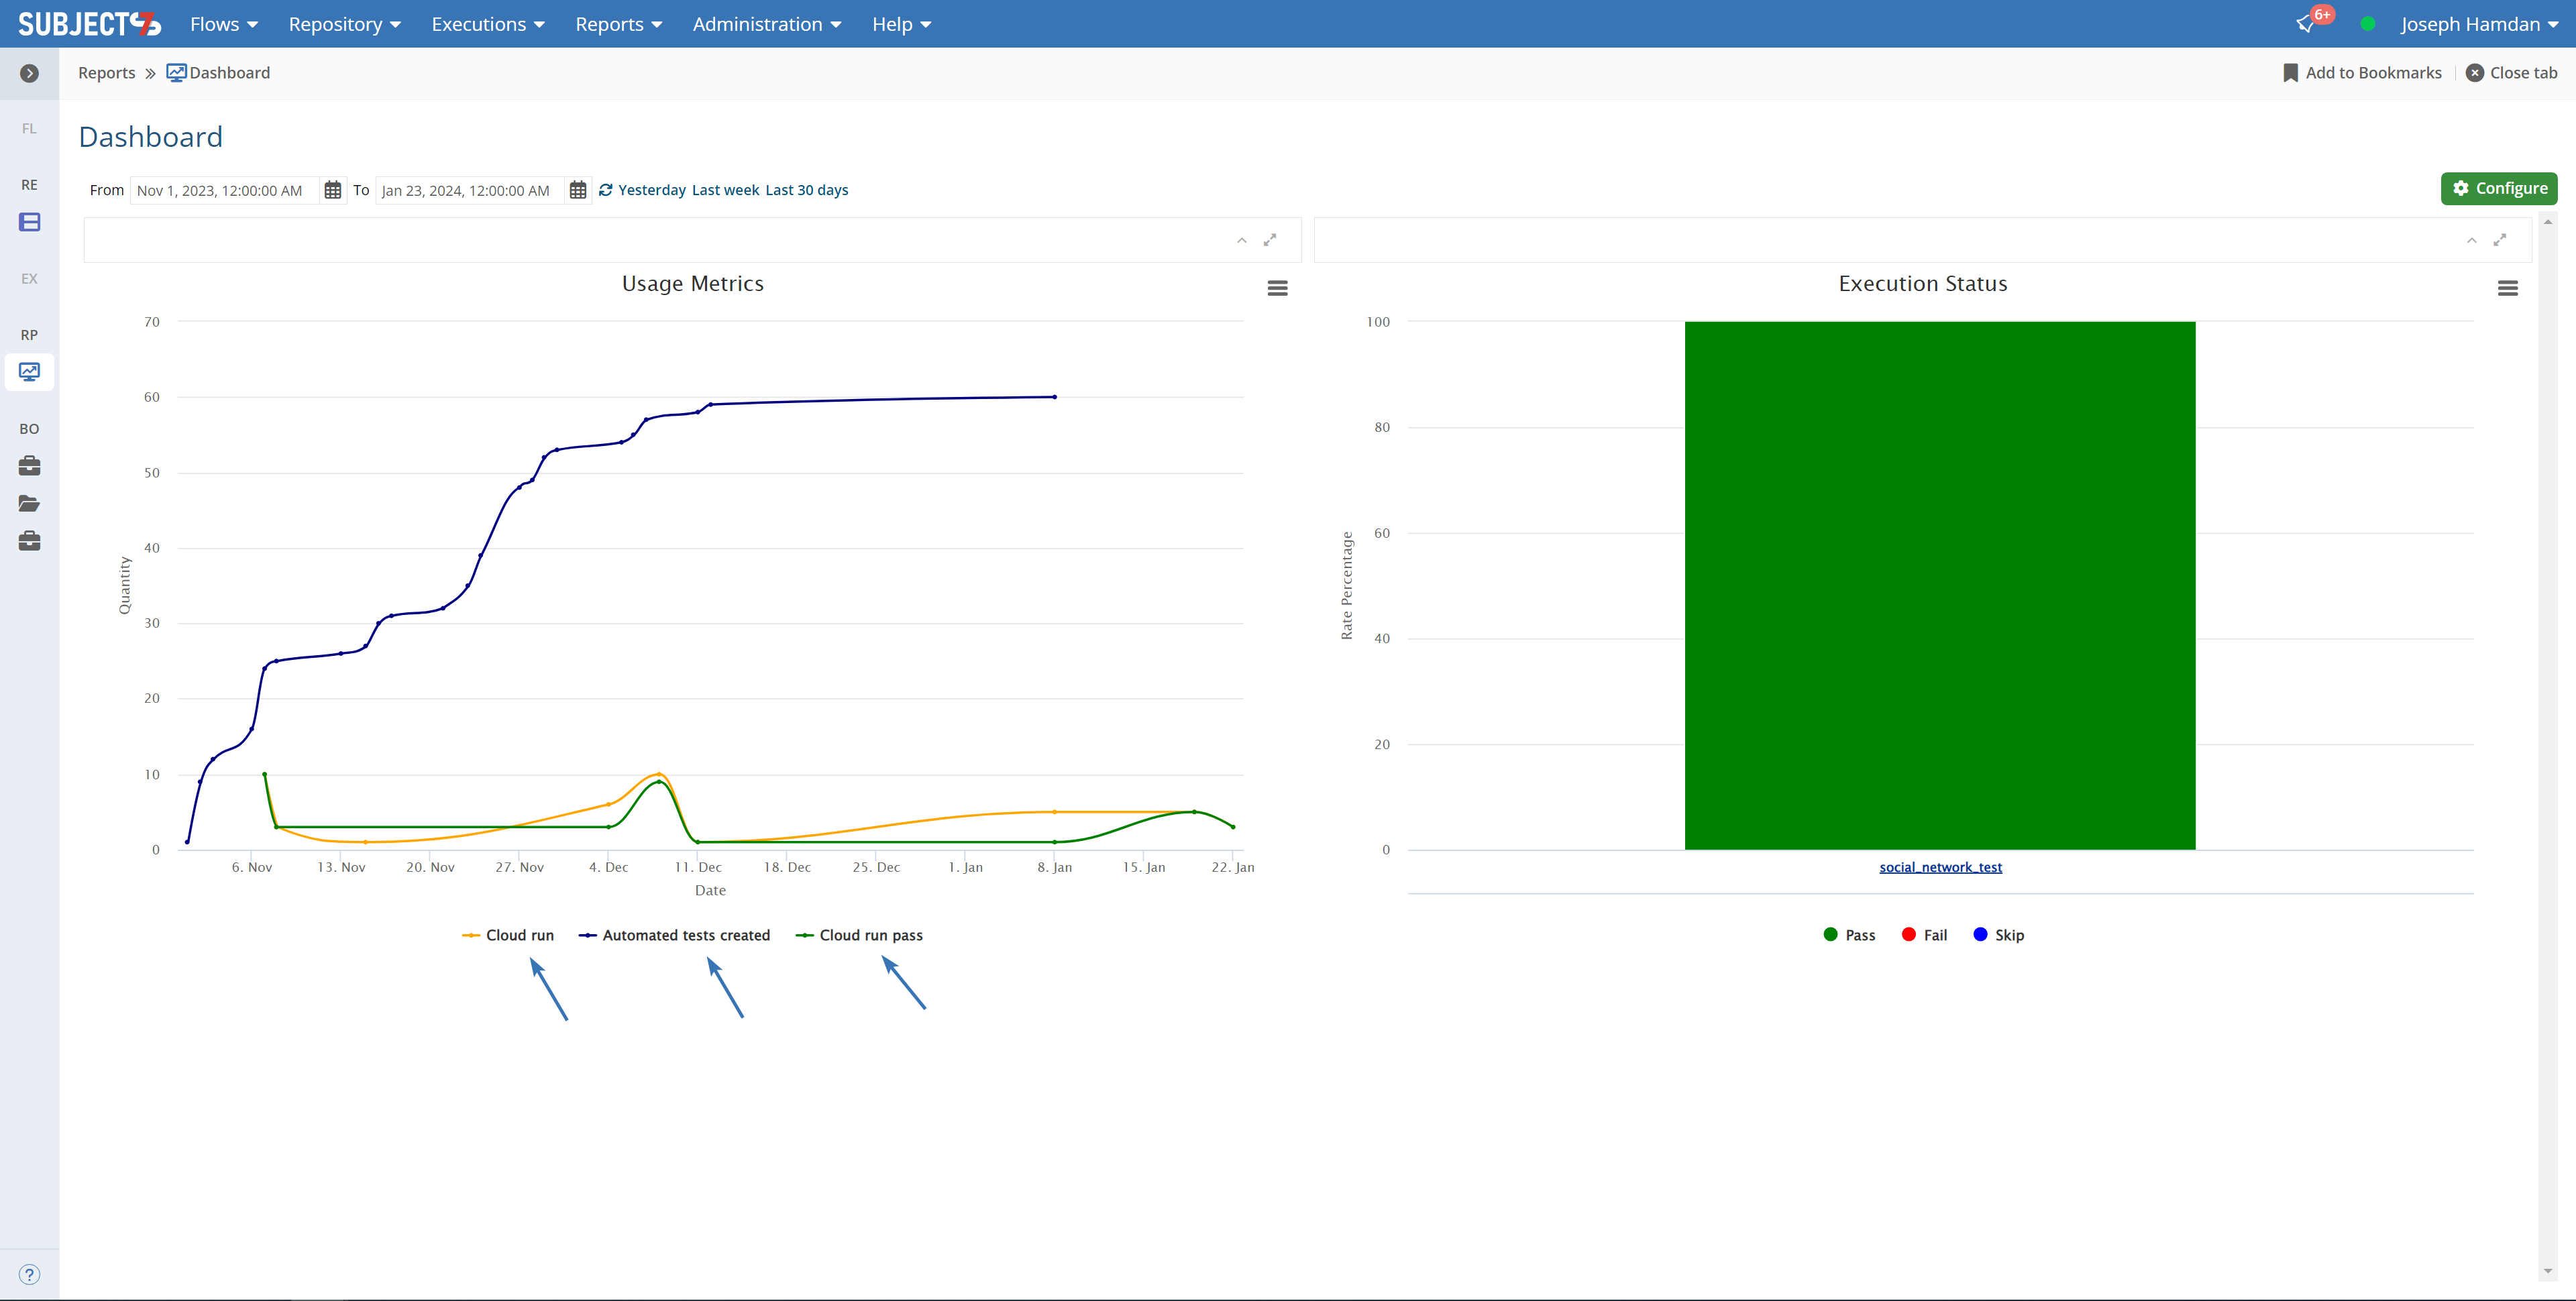
A portlet can also be maximized using the maximize button highlighted below. Note that the period of time on the dashboard affects all non-maximized portlets. If a portlet is maximized, then changing the period of time will only adjust values for the maximized portlet.


| Info | ||
|---|---|---|
| ||
The number of test cases created on the dashboard is aggregated |
...